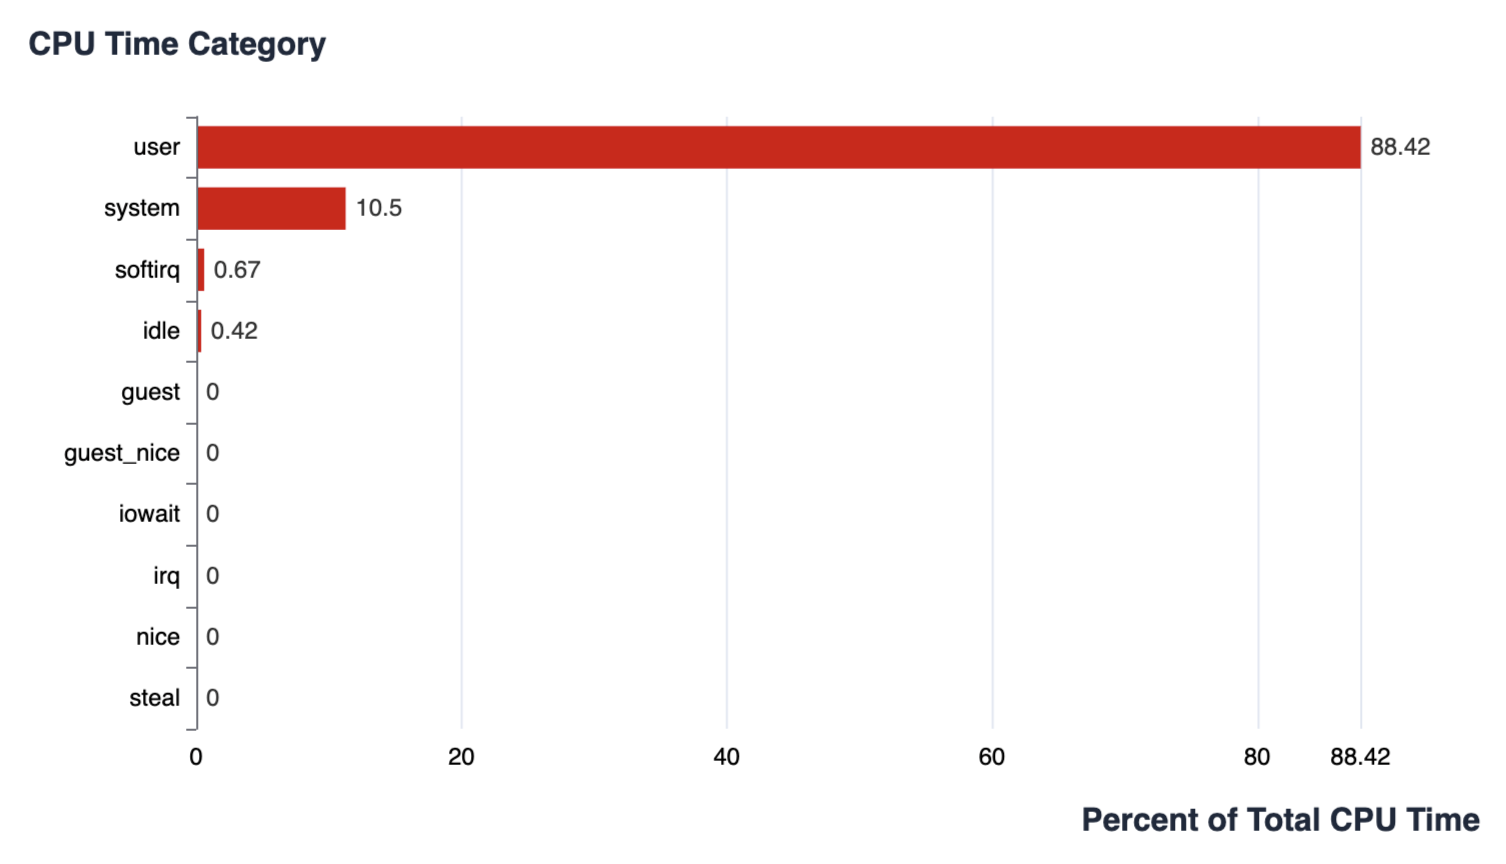
Get a real-time snapshot of how your CPU time is allocated across all workload categories. This animated racing bar chart makes it easy to compare usage patterns. See how user activity, system overhead, idle time, and I/O wait contribute to overall CPU usage.