Is Your Jellyfin Actually Using the GPU?

Founding engineer at yeet, working on kernel-side observability and the tooling around it. I write about eBPF, Linux internals, and why your telemetry bill looks the way it does.
There is a 6-watt Intel chip under a remarkable number of the Jellyfin servers on this planet. The N100 mini PC costs about as much as a single one year streaming subscription, idles at single-digit watts, and its iGPU chews through 4K HEVC without waking the fan. That iGPU is the entire reason you bought it.
So you did the ritual. Dashboard, Playback, Transcoding, Hardware acceleration: Intel QuickSync (QSV). Tick every codec box. Save. Jellyfin says nothing, which you decide to interpret as approval.
Then it's 9:47pm, somebody is watching a 4K rip on the TV in the other room, and the spinner shows up. You open the dashboard. It says:
Transcoding (video)
  4K HEVC → 1080p H264   reason: bitrate exceeds limit
Transcoding with what? That line is the same whether your GPU or your four little Gracemont cores are doing the work.
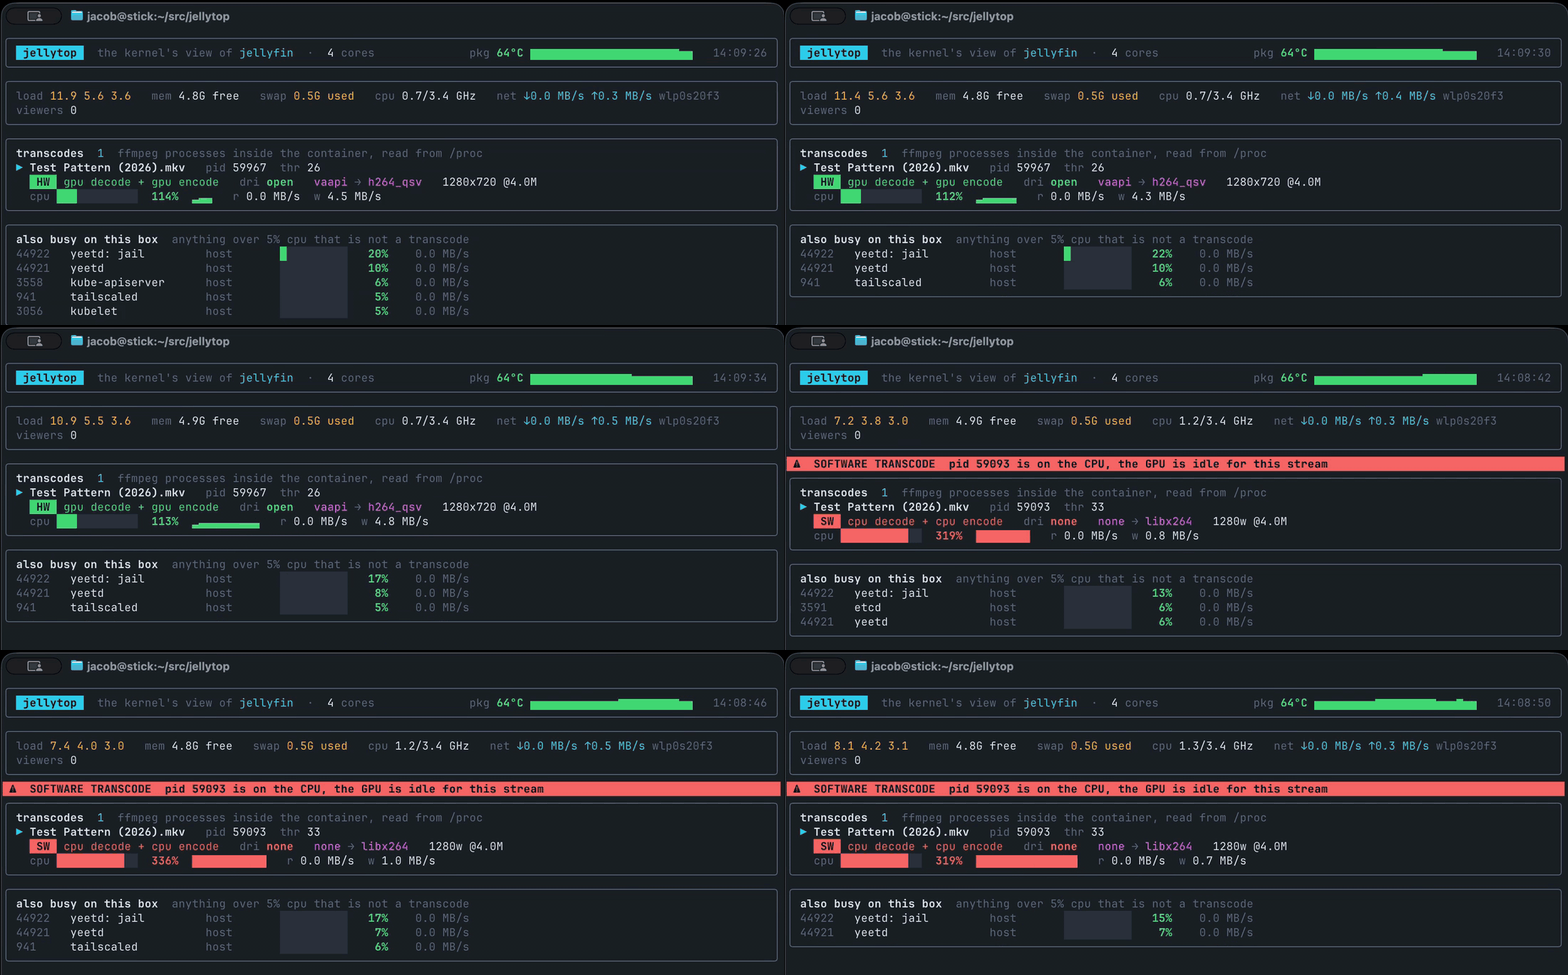
TL;DR
We wrote jellytop, a top for Jellyfin transcodes, on yeet.
It asks the kernel three things about every ffmpeg Jellyfin spawns and shows
you the answer live:
- Does it hold
/dev/dri/renderD128open? Then the GPU is in the loop. - What was it told to do? The argv says whether decode, encode, or both are on the GPU.
- What is it costing? CPU ticks, per process, from
/proc.
Then we ran it on an N100 with Quick Sync on, off, and half on. The half-on case is likely your issue, and its sneakily hiding in Jellyfin's dashboard.
Jellyfin can't answer this, and it isn't Jellyfin's fault
Jellyfin knows what it asked ffmpeg to do.
However it has no way of knowing how much CPU that child process is burning, or what could possibly be causing your stream to stutter. Realisticaly, it shouldnt, its not Jellyfin's fault, but it is your problem. So lets solve it.
The box has an answer. The kernel stores info on every process it runs, and three of them hold the answer we're looking for:
/proc/<pid>/cmdline   what ffmpeg was actually told to do
/proc/<pid>/fd        every file it holds open, including /dev/dri/renderD128
/proc/<pid>/stat      the CPU ticks it has been billed, so far
If ffmpeg holds a file descriptor on /dev/dri/renderD128, the GPU is in the
loop. If it doesn't, it isn't. There's no log to grep and no setting to
trust. It's a fact about an open file, and the kernel is the one holding it
open.
So we stopped reading the dashboard and wrote our own.
jellytop
yeet is a JavaScript runtime that sits on top of the Linux
kernel. One daemon per machine. A script gets a GraphQL view of the system
(/proc, docker, hwmon, the network tables, way way more), eBPF if it wants it,
and an increasingly flexible way of displaying it. It does not get fetch, a filesystem, or exec, which for
something you're about to run as a service on the box that holds your family photos is a feature.
The whole tool is about 200 lines. Here are the parts that matter.
First, find the container. Jellyfin in a homelab is almost always Docker, and the daemon already talks to Docker, so this is a query:
const { data } = await yeet.graph.query(`{
  docker { list_containers { id names } }
}`);
const id = data.docker.list_containers
  .find((c) => c.names.some((n) => n.replace(/^\//, "") === "jellyfin")).id;
That id shows up in the cgroup path of every process inside the container,
which is how we tell Jellyfin's ffmpeg from any other ffmpeg on the host.
Second, subscribe to every process, once a second, with the two fields that cost nothing to read:
yeet.graph.subscribe(`subscription {
  procs(interval_ms: 1000) {
    pid
    stat { comm utime stime num_threads }
    io { read_bytes write_bytes }
  }
}`, (sample) => { /* ... */ });
utime + stime are CPU ticks. Subtract the previous sample, divide by the
kernel's tick rate (the graph exposes host.ticks_per_second), and you have the
same CPU% top would show you, except you computed it in four lines of
JavaScript and you get to decide what it's grouped by.
Third, for any process named ffmpeg, ask the two questions we care about.
const RENDER_NODE = /^\/dev\/dri\/renderD\d+$/;

const { data } = await yeet.graph.query(`{
  proc(pid: ${pid}) { cmdline cgroups { pathname } fds { kind path } }
}`);

// 1. Is the GPU in the loop? Only if ffmpeg holds a render node open.
const gpu = data.proc.fds.some(
  (f) => f.kind === "PATH" && RENDER_NODE.test(f.path ?? ""),
);

// 2. Is this Jellyfin's ffmpeg? Only if it lives in the container's cgroup.
const inContainer = data.proc.cgroups.some((c) => c.pathname.includes(id));
That gpu boolean is the whole post. Everything else is formatting, and one
word of judgment: hardware decode and hardware encode is hw, neither is
sw, and one without the other is mixed, which turns out to be the
interesting one.
why that lookup is per-pid rather than in the big subscription?
Our first version asked for cgroups on all 350 processes every tick. A process
that exits between the daemon walking /proc and reading its cgroup file
fails the entire sample, and on a box running Docker something exits every few
seconds. Ask per pid, catch the miss, forget it next tick. Same data, far
fewer tears.
We also buil da tiny parser for the command line because the argv Jellyfin passes gives us an idea of the intent even if it may not be what the dashboard says.
function describe(argv) {
  const flag = (n) => { const i = argv.indexOf(n); return i >= 0 ? argv[i + 1] : null; };
  return {
    file: argv.find((a) => a.startsWith("file:"))?.slice(5).split("/").pop(),
    hwaccel: flag("-hwaccel") ?? "none",
    vcodec: flag("-codec:v:0") ?? "copy",
    kbps: Math.round(Number(flag("-b:v") ?? flag("-maxrate") ?? 0) / 1000),
  };
}
And because this is a homelab post and your N100 is in a closet, the package temperature comes along for free from the same graph:
yeet.graph.subscribe(`subscription {
  hwmons(by: { name: "coretemp" }, interval_ms: 1000) { temps { name input } }
}`, ({ data }) => {
  const pkg = data.hwmons.flatMap((h) => h.temps).find((t) => /^Package/.test(t.name));
  temp.set(pkg.input / 1000);
});
What the kernel said
Our test box is an N100, Fedora 42, Jellyfin 12.1 in Docker with
--device /dev/dri. The library is a synthetic 1080p test pattern because the
kernel does not care what the movie is. We forced a transcode to 720p by asking
for a bitrate the file doesn't have. One thing to note on the CPU numbers:
these transcodes are unthrottled, so ffmpeg runs as fast as the box lets it
rather than at playback speed. So CPU% is really "how hard the box is working to
get ahead".
With QSV configured, and the device actually passed into the container:
jellytop  container=jellyfin  transcodes=1   cpu pkg 54°C

  PID     MODE   DRI   DECODE  ENCODE     TARGET           CPU% THR       READ      WRITE  FILE
  20858   hw     open  vaapi   h264_qsv   1280x720 @2800k   120  26   0.0 MB/s   4.6 MB/s  Test Pattern (2026).mkv

  also busy on this box
    2134    jellyfin          jellyfin      5%   0.0 MB/s
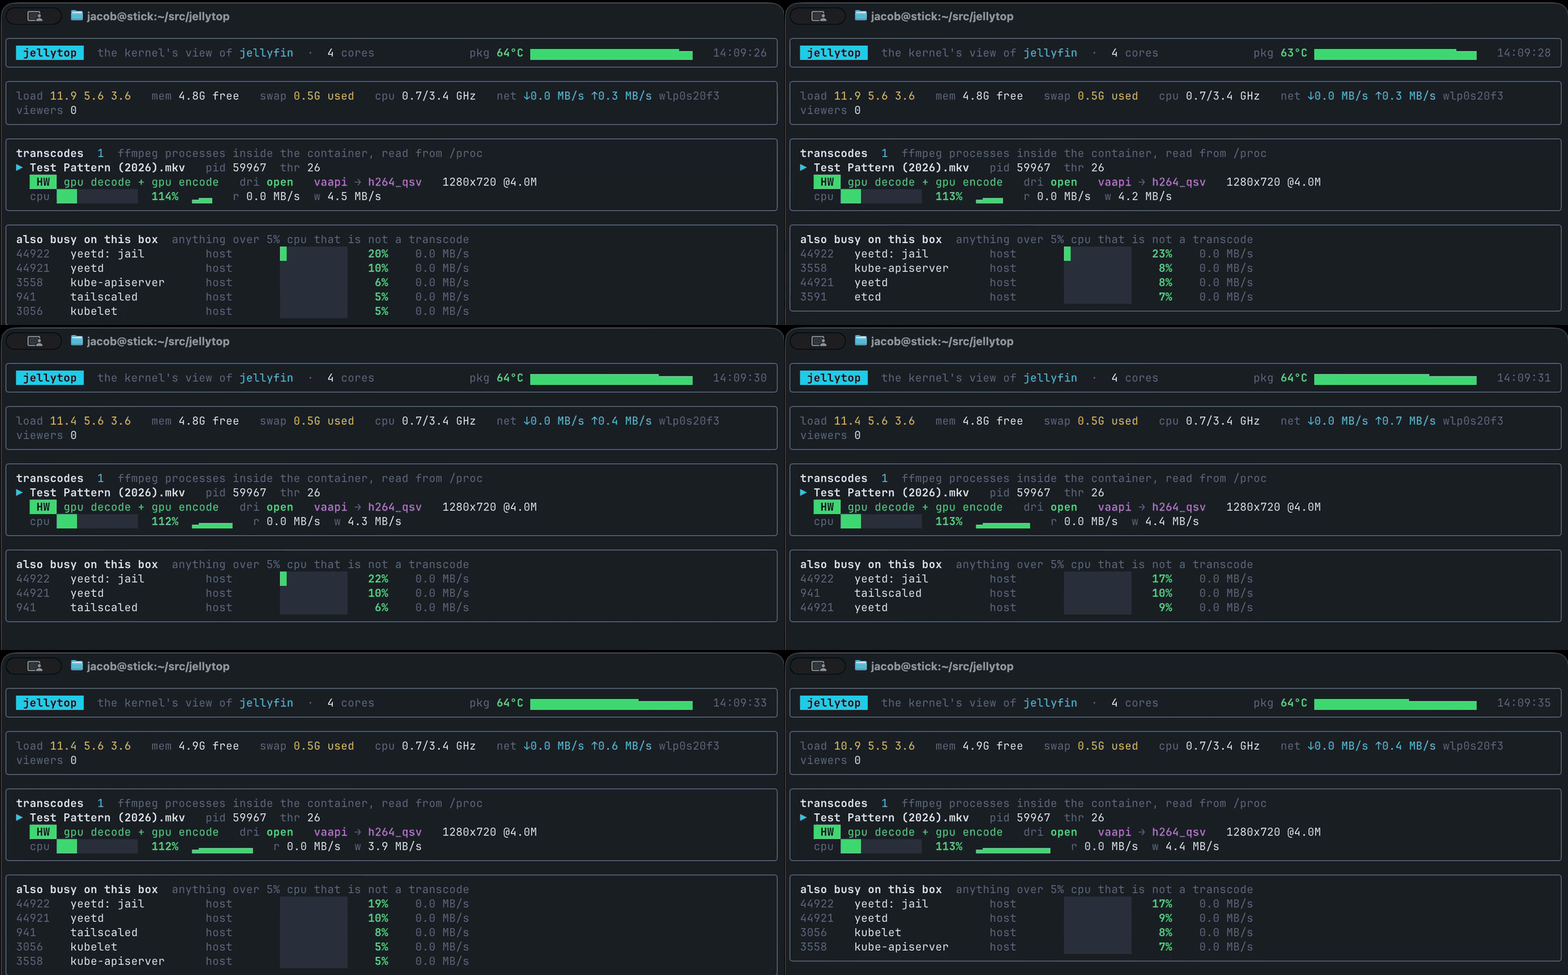
So is the GPU being used? Well,
DRI open- ffmpeg holds
/dev/dri/renderD128 - The argv says
-hwaccel vaapiandh264_qsv
the whole pipeline encodes and decodes on a little more than a single core, Package temperature 54°C. The N100 is doing what the N100 is for.
Just to be sure this is working how we'd expect, lets try turning off hardware acceleration:
jellytop  container=jellyfin  transcodes=1   cpu pkg 64°C

  PID     MODE   DRI   DECODE  ENCODE     TARGET           CPU% THR       READ      WRITE  FILE
  21138   sw     none  none    libx264    1280w @2900k      369  33   0.0 MB/s   0.4 MB/s  Test Pattern (2026).mkv

  also busy on this box
    nothing over 5% cpu
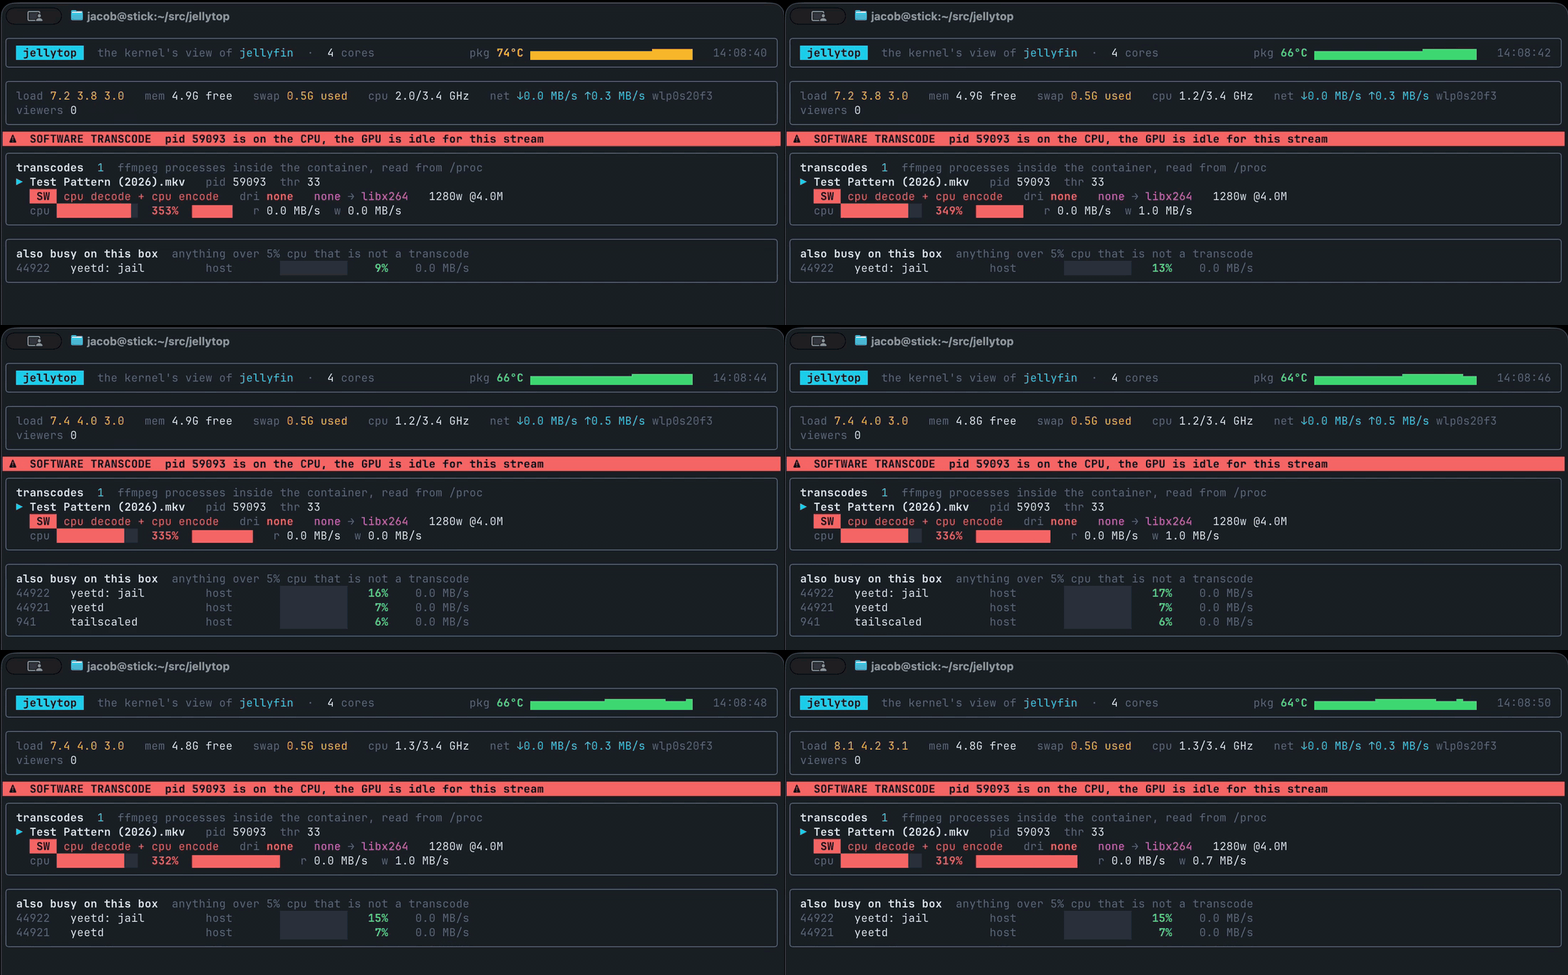
DRI none- No render node in the fd table
libx264in the argv- 369% CPU on 33 threads
That is all four cores, ten degrees hotter, for a 1080p source going to 720p. A 4K HEVC source is four times the pixels and a heavier decode, and there is no fifth core. Do the math, then watch the spinner.
Jellyfin's dashboard showed the same word for both runs: Transcoding.
The one that actually bites
Those two are the easy cases, and in fairness Jellyfin makes the second one visible if you go looking: the dropdown says None. The case that costs people weeks is the one in between.
We put QSV back on, then unticked one box: HEVC in the hardware decoding list. That's the box you untick the night a 10-bit file glitches once and a forum thread says to try it. Then we played a 10-bit HEVC file, which is what nearly every 4K release is.
jellytop  container=jellyfin  transcodes=1   cpu pkg 59°C

  PID     MODE   DRI   DECODE  ENCODE     TARGET           CPU% THR       READ      WRITE  FILE
  21371   mixed  open  none    h264_qsv   1280w @3000k      348  30   0.0 MB/s   2.1 MB/s  Test Pattern HDR (2026).mkv

  also busy on this box
    nothing over 5% cpu
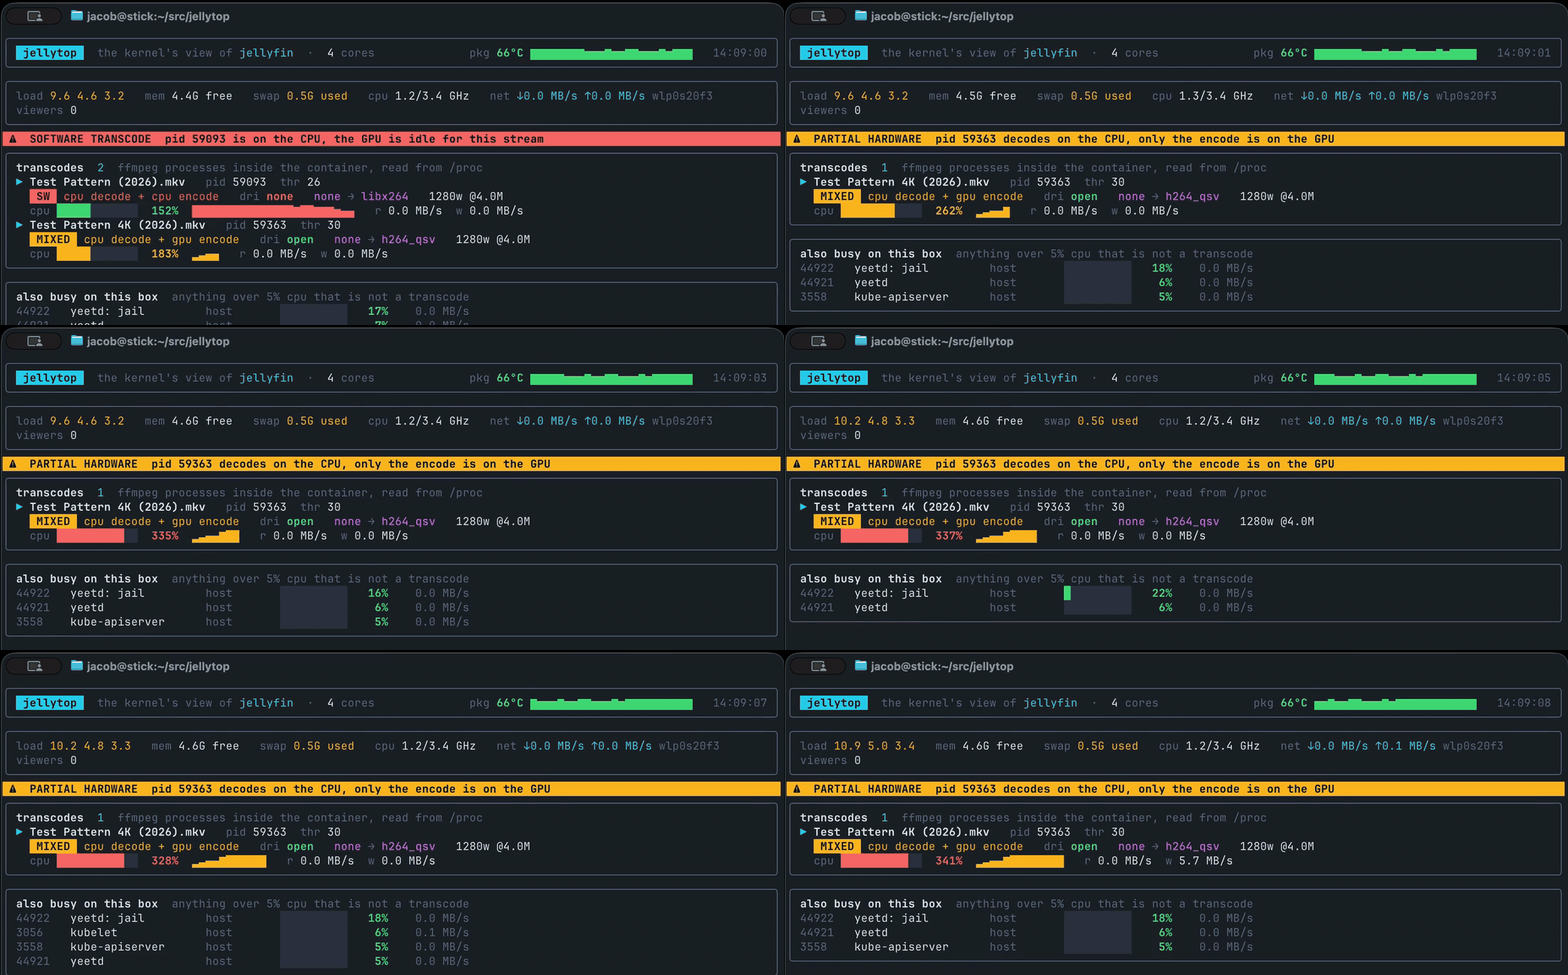
Read that row left to right. DRI open: the render node is held. ENCODE h264_qsv: the encode is on the GPU. DECODE none: there's no -hwaccel in
the argv at all, so the decode is on the CPU, and the software scale
filter is in the chain too. jellytop calls that mixed. 348% CPU for one
1080p stream, within a rounding error of the pure-CPU run, from the box
that is "using hardware transcoding." Give it the 4K version and it's a
slideshow.
The argv Jellyfin built, straight from /proc/<pid>/cmdline:
ffmpeg -init_hw_device vaapi=va:,vendor_id=0x8086,driver=iHD
       -init_hw_device qsv=qs@va -filter_hw_device qs
       -i "file:/media/Movies/Test Pattern HDR (2026).mkv"
       -codec:v:0 h264_qsv
       -vf "setparams=...,scale=trunc(min(max(iw\,ih*a)\,1280)/2)*2:...,format=nv12"
       -low_power 1 -preset veryfast -b:v 3000000 ...
Hardware device initialised, hardware encoder selected, and no hardware decoder anywhere. Jellyfin did exactly what the settings told it to, the dashboard said Transcoding, and nothing anywhere said "by the way, half of this is on the CPU."
"Also busy on this box"
Half the time a stream buffers, the transcode is fine and something else is eating the machine. That's what the bottom panel is for: every process on the host over 5% CPU, with its read throughput, and whether it lives in the Jellyfin container or not.
In an earlier run on this box, before a reboot, that panel caught a stray
python3 from an unrelated test burning a whole core next to the transcode,
and kswapd0 at 64% because the machine was deep in swap. On yours it'll be
Sonarr unpacking a season, Immich
running face detection, a scheduled library scan, or a backup job that someone
set to 10pm because "nobody's using the server then." The kernel bills CPU to
pids, not to feelings, so the answer is just sitting there.
When the panel names a process and you still don't know why it's busy,
you don't have to extend jellytop. The system graph it reads from is a typed
GraphQL schema over the whole box: every process with its fds, maps, cgroups
and io, the container list, the TCP table, the sensors. Point your coding
agent at it with yeet graph dump, tell it what you're trying to find out,
and let it explore. "Which process is reading the same disk as the transcode"
or "what is Sonarr's child doing with 30 threads" is a query it can write,
run with yeet graph query, and read back to you.
Leave it running, dial in when you care
yeet run ./main.tsx is for a quick look. The closet box wants something that
outlives your terminal, so the repo ships a service file and the daemon
takes it from there:
git clone https://github.com/yeet-src/jellytop && cd jellytop
yeet service import -n jellytop.service.toml
That hands the daemon two units: the tool, and a tiny web server whose /tty
route is the tool's screen. yeet service tree jellytop shows what you got:
● fine_dig (jellytop) running restart=always
  ├─app isolate id=4
  └─web web-server ws://0.0.0.0:9297
      └─GET /tty app
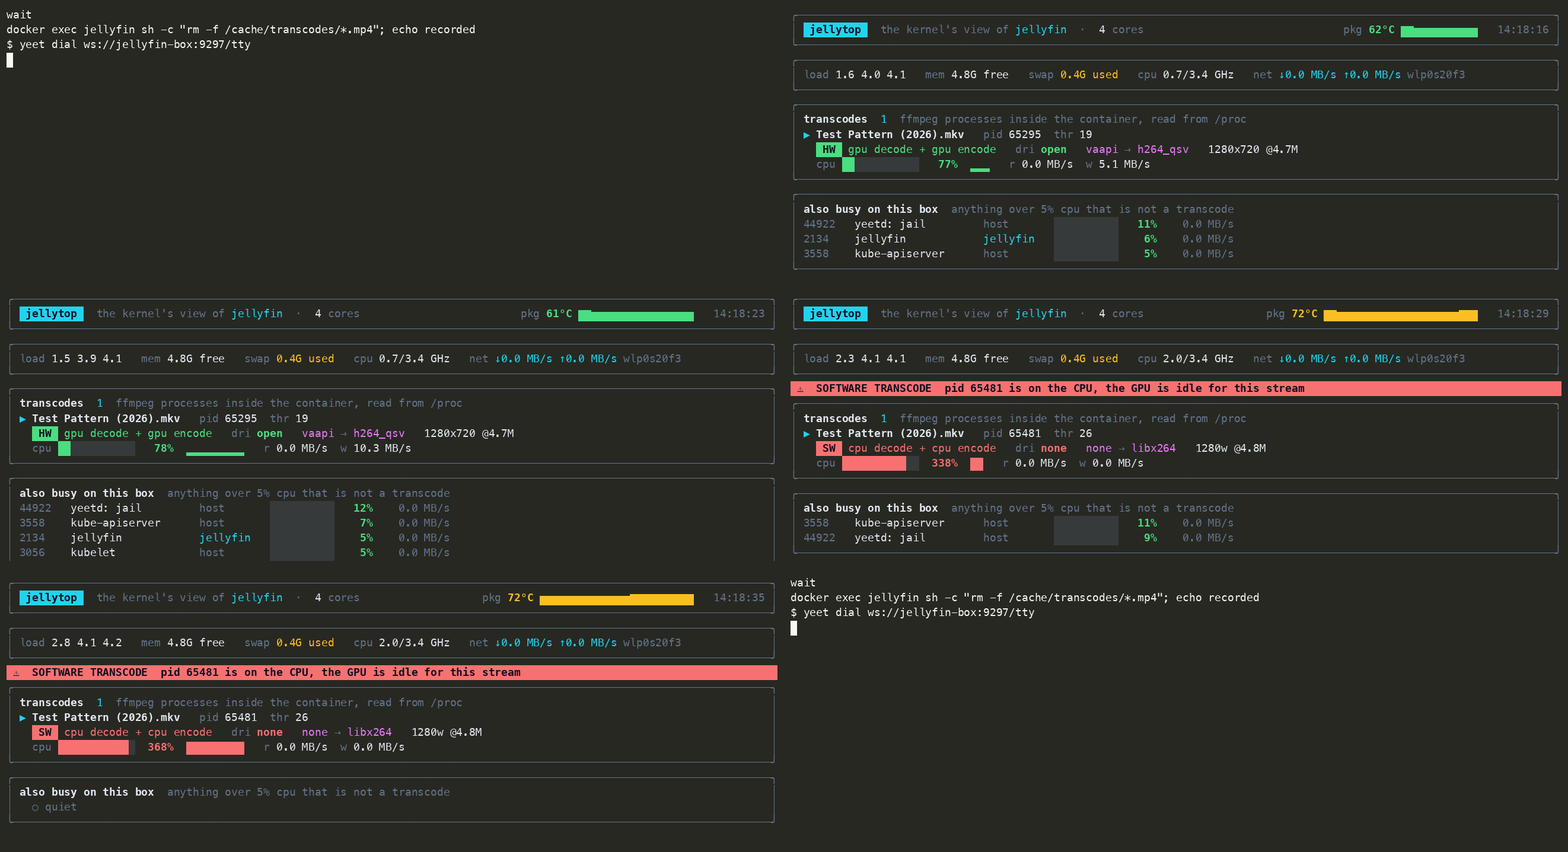
It restarts if it dies and comes up on boot. The part that matters is the other direction. When the spinner shows up at 9:47pm, you don't SSH in and go looking for a tmux session. From the box, or from your laptop over the tailnet, you dial the screen:
yeet dial ws://jellyfin-box:9297/tty
Your terminal becomes the TUI, with the history it has been keeping since
boot. Ctrl+C detaches and the service carries on. Same tool, same kernel
facts, no yeet run left running in a terminal you closed last Tuesday.
The end
The dashboard was never lying. It just doesn't know. It reports the request;
the kernel reports the outcome, and on a box you own, the outcome is one fd
entry away.
curl -fsSL https://yeet.cx | sh
yeet login
yeet run github:yeet-src/jellytop