An L7 Firewall in the Kernel

"This is some Jane Street sh*t." That was the reaction from a Director of Engineering at a Fortune 500 company.
Firewalls that decide on application data, like an HTTP header rather than only an IP address and a port, almost always run that decision in a userspace proxy. The packet gets copied out of the kernel, the TCP stream gets rebuilt, the inspection engine runs, and the result gets copied back down. It works, and it costs milliseconds per request.
We thought that layer could be faster and easier to run. So we built a firewall that makes its decision in the kernel with eBPF, and lets you write the policy as a JavaScript app. Sounds fun, right?
It was. Matching a header costs under 200 nanoseconds, the whole per-request decision lands in microseconds, and since the policy is just a JavaScript app, changing it takes no rebuild, redeploy, or restart. It's already running in front of real enterprise traffic, on cleartext HTTP/2 behind the customer's TLS termination. Here's how it works, what we measured, and what we haven't measured yet.
Why In-Kernel L7 Was Impractical
Deciding on HTTP in the kernel used to be impractical. The eBPF verifier won't load a program unless it can prove every loop terminates. So most normal parsing code just won't load. We did find one 2024 study of L7 header parsing in eBPF could match about 48 bytes of payload, nowhere near enough to decide on a real HTTP/2 header block.
But times have changed, and recent updates to the kernel have pushed in-kernel L7 matching from tens of bytes into the kilobytes, and we aren't the only ones building on it. In 2026 a team from ETH Zürich, NYU, Nvidia, and Politecnico di Milano published Enforcing Application-Layer Policies in eBPF, describing a system called Beeline that synthesizes eBPF data planes for service-mesh L7 policies. They analyzed 4,699 Envoy configuration files across 2,417 open-source projects and found that 89% of the policies could be implemented in eBPF with no kernel changes. That is a statement about what is expressible in the kernel, not a count of what anyone has deployed there, and it is the number that convinced us in-kernel L7 covers most of the real workload rather than some edge case. To parse inside the verifier's limits, they landed on DFA-based parsing. Our CEO and architect, Julian Goldstein, had arrived at Aho-Corasick before we found the paper, for the same reason the verifier forces on everyone.
Match Inputs
A normal packet filter matches on the 5-tuple: source IP, destination IP, source port, destination port, protocol. That is layer 3 and 4.
Ours matches on values inside HTTP/2: the :authority (host), the User-Agent, and the source address, with X-Forwarded-For and PROXY protocol resolution when it sits behind a trusted load balancer. Rules combine those with boolean logic, for example:
host == "api.example.com" && src in 127.0.0.0/8 && ua ~ "Diffbot"
A common use case today for this is blocking crawlers and agents by User-Agent (GPTBot, ClaudeBot, PerplexityBot, curl/, and so on) on specific hosts, with a source constraint so a rule only applies where you expect that traffic to come from.
The XDP Hook Point
The match runs at XDP, the eBPF hook in the NIC driver, before the kernel allocates a socket buffer and before the packet touches the network stack. The verdict, pass or drop, is produced right there.
We hook at XDP on purpose, and it's the biggest thing separating us from the others. Beeline hooks at the socket layer, after the kernel has reassembled the TCP stream and decrypted TLS through kTLS. That hands you a clean byte stream, which is nice. Hooking earlier means we reassemble the stream ourselves (more on that in the fragmentation section), and we pay that cost because XDP earns it back.
A packet that dies at XDP never becomes a socket buffer and never enters the stack. It's the cheapest drop Linux has because the kernel spends nothing on the traffic we were going to reject anyway.
Enforcement also sits below userspace. You write and submit rules from JS, and the runtime compiles them into the structures the kernel program reads. All the expressive work, writing rules, managing config, streaming logs, lives in a normal JS app. The verdict itself runs in the kernel, where it's cheap and where a compromised userspace process can't quietly switch it off.
Updating rules is a git push. No rebuild, no redeploy, no restart. Nifty.
TLS Termination and the Cleartext Constraint
TLS does not fit in, and that constraint governs everything above. XDP sees bytes as they come off the NIC. If those bytes are TLS records, the :authority and User-Agent inside them are ciphertext, and no amount of eBPF cleverness reads a header the machine does not yet have the plaintext for.
So the firewall inspects cleartext HTTP/2 only. It runs on origin servers that sit behind something which has already terminated TLS. In the production deployment this post describes, the customer's own edge PoPs terminate TLS and load balance, and our XDP program runs after that, on the decrypted HTTP/2 traffic arriving at the origin. That is also why the rule language bothers with X-Forwarded-For and PROXY protocol: by the time we see a request, the original client address is a header, not a packet field, and a trusted proxy in front is an assumption the design already makes.
This is a real limit, not a technicality. If you want header enforcement at a box that also does the TLS handshake, this is the wrong tool and a proxy or a kTLS-based approach like Beeline's is the right one. What this buys instead is placement: an origin fleet usually has many machines each handling post-termination traffic, and dropping unwanted requests there costs one XDP program per machine and no new hop in the path.
The trade is the same one that makes the whole design work. Hooking before the network stack is what makes a drop cost nearly nothing, and it is also what puts us before any decryption the kernel could do. You cannot have both from the same hook.
Aho-Corasick Matching
Checking a User-Agent against a list of banned substrings one at a time means scanning the header once per pattern. Instead we compile every UA substring across every rule into one Aho-Corasick automaton: a DFA that reads the header a byte at a time and reports every pattern that hit in a single pass.
The scan is linear in the length of the header and doesn't slow down as you add patterns. Ten patterns or ten thousand, the header is still a couple hundred bytes and you make one pass over it. More rules cost table size, not scan time.
It's also the only shape that gets you into the kernel. The verifier only loads a program if it can prove every loop terminates, and a single bounded loop with one table lookup per byte, capped by header length, is trivial for it to bound. Match one pattern at a time and you've got a nested loop, which is much harder to get past the verifier. That constraint is what kept in-kernel L7 hard for years, and it's why both we and the Beeline team ended up on DFAs.
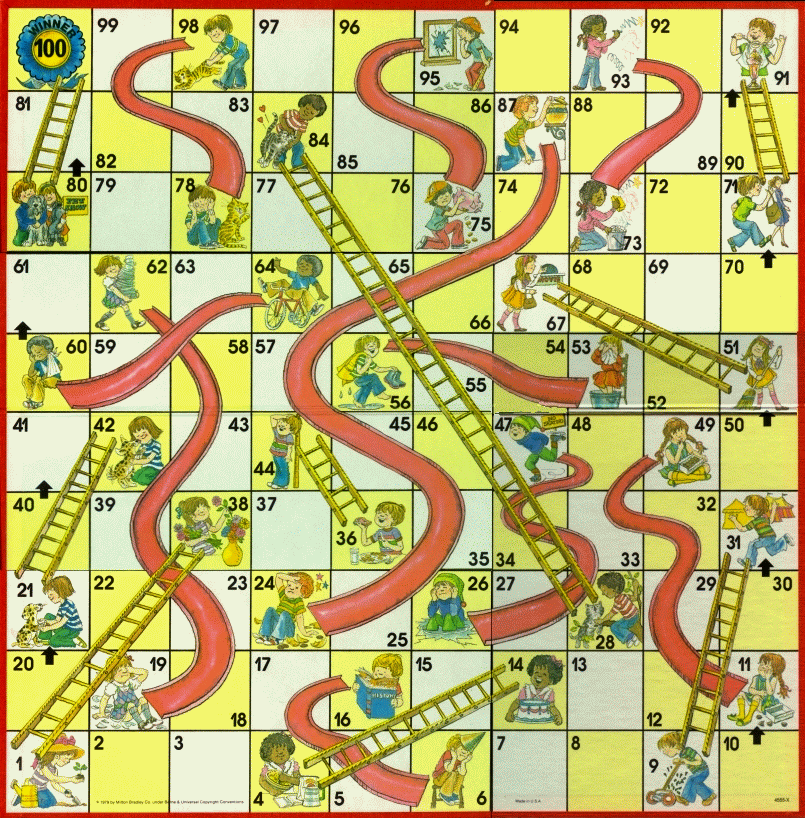
Basically we compile one enormous chutes-and-ladders board. Every packet the firewall sees plays the game: win and you're blocked, lose and you're allowed.
Automaton Capacity and Rule Updates
The state machine uses 16-bit state IDs, so it holds up to 32,767 states. In practice that is about 4,000 User-Agent patterns today, with headroom, since real blocklists share prefixes and pack tighter than the worst case. We have a path to roughly 16,000 patterns; it costs more memory at compile time, so it is planned rather than on by default (modeled, not yet shipped).
Rule changes happen out of band. When you edit the rule set, the machine is recompiled and swapped in, typically in a few seconds, off the packet path. Packets keep being matched against the current rules until the new set is ready, then the swap is atomic. Rebuilding the whole automaton on each change is a property of the data structure, since its fallback links are global, so we treat updates as a background compile plus a swap rather than an in-place edit.
Measured Costs
Two numbers matter here, and they are easy to conflate. Matching a header in the kernel costs under 200 nanoseconds. Handling a whole request costs tens of microseconds. The first is the step we designed; the second is what you would actually feel.
We export per-packet processing time as a Prometheus histogram, straight out of the kernel program. It measures the time the eBPF program spends matching, per packet. That is the sub-200ns figure, and it is a narrow measurement on purpose: it is the cost of the automaton, not the cost of the firewall.
In one capture the p50 of that matching step sat well under 200 nanoseconds and the p95 was about 775 nanoseconds. The p99 usually stays under a microsecond and rises into the low microseconds under heavier traffic. At the far tail we see occasional spikes toward 3 milliseconds.
The per-request cost is larger, and the dashboard below shows it: per-packet processing time on that panel runs around 20 to 30 microseconds. The gap between the two is everything the matcher doesn't do. Receiving the packet, parsing HTTP/2 frames, looking up connection state, and updating the HPACK dynamic table all cost real time on top of the match. Microseconds per request is the number to hold onto.
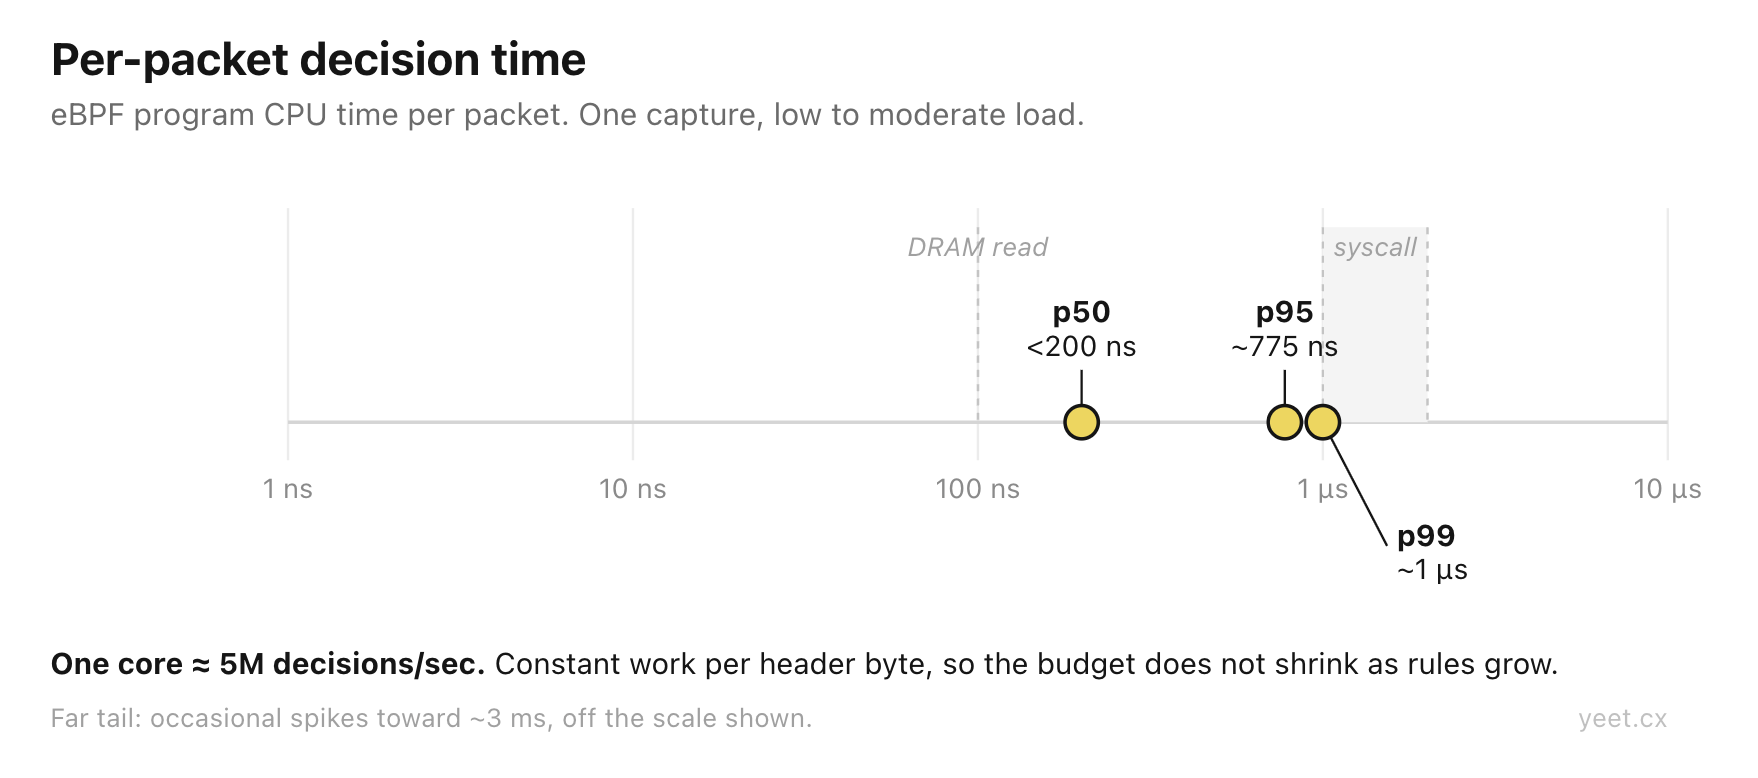
Matching cost only, from one capture at loopback rates. This is the automaton's time, not the per-request cost.
To put 200 nanoseconds in context, here is roughly where it sits on the latency ladder every systems engineer carries around:
| Operation | Approximate cost |
|---|---|
| L1 cache reference | ~1 ns |
| Main memory reference | ~100 ns |
| This firewall's header match (p50) | <200 ns |
| System call (getpid, round trip) | ~1–2 µs |
| Context switch | ~3–5 µs |
| This firewall's per-request processing | ~20–30 µs |
| Userspace proxy hop (copy up, reassemble, inspect, copy down) | ~1+ ms |
The match costs about the same as two reads from DRAM. The request around it costs tens of microseconds, which is still one to two orders of magnitude under the millisecond-scale hop a userspace proxy adds, and that comparison is the one worth making.
The conditions behind those figures matter as much as the figures themselves, and ours were modest. The dashboard below is a loopback test: traffic on 127.0.0.1:8080, about 46 requests per second, with four active rules. That is enough to show the mechanism works and to measure what a match costs. It is nowhere near enough to tell you how the system behaves at line rate.
Both figures are also in-kernel times rather than end-to-end appliance latency. A userspace inspection layer pays for the syscall, the copies, the TCP reassembly, and the scheduler, per request, which is where the milliseconds go. Neither of our numbers includes a full round trip through a box, so neither is directly comparable to a vendor's published end-to-end latency.
We have not benchmarked throughput at all. You could divide one second by 200 nanoseconds and get 5 million matches per second, and an earlier version of this post did exactly that. It is the wrong number to quote. It reciprocates a median when the p95 of 775 nanoseconds puts the mean higher, it covers only the matching step rather than the 20 to 30 µs of work around it, and it comes from a capture at loopback rates. What the sub-200ns figure supports is narrower: matching is cheap enough that it is not the limiting factor, and it stays cheap as the rule set grows, because the automaton does constant work per header byte. Ten patterns or ten thousand, same scan. Where the ceiling actually sits is a measurement we owe you, and producing it is what the production rollout is for.
HPACK Dynamic Table Tracking
HTTP/2 compresses headers with HPACK, which keeps a dynamic table. A client can send its User-Agent in full once and then reference it by index on every later request. A matcher that only looks at literal strings would see the header on the first request and then miss it on every one after.
Beeline handles HTTP/2 by requiring every pod behind it to disable HPACK dynamic-table caching (Huffman-encoded headers stay fine; it is the stateful compression that has to go). That's a workable trade inside a service mesh, where you control every pod. We can't make it. Even post-termination, an origin fleet is serving requests that originated with arbitrary clients, and you can't ask a scraper to please turn off header compression.
So we instrument the dynamic table directly. The dashboard shows table activity, header hits, and health signals like desyncs and mid-stream joins. A matcher that silently stops seeing a header is worse than one that tells you when it might.
Operations and Metrics
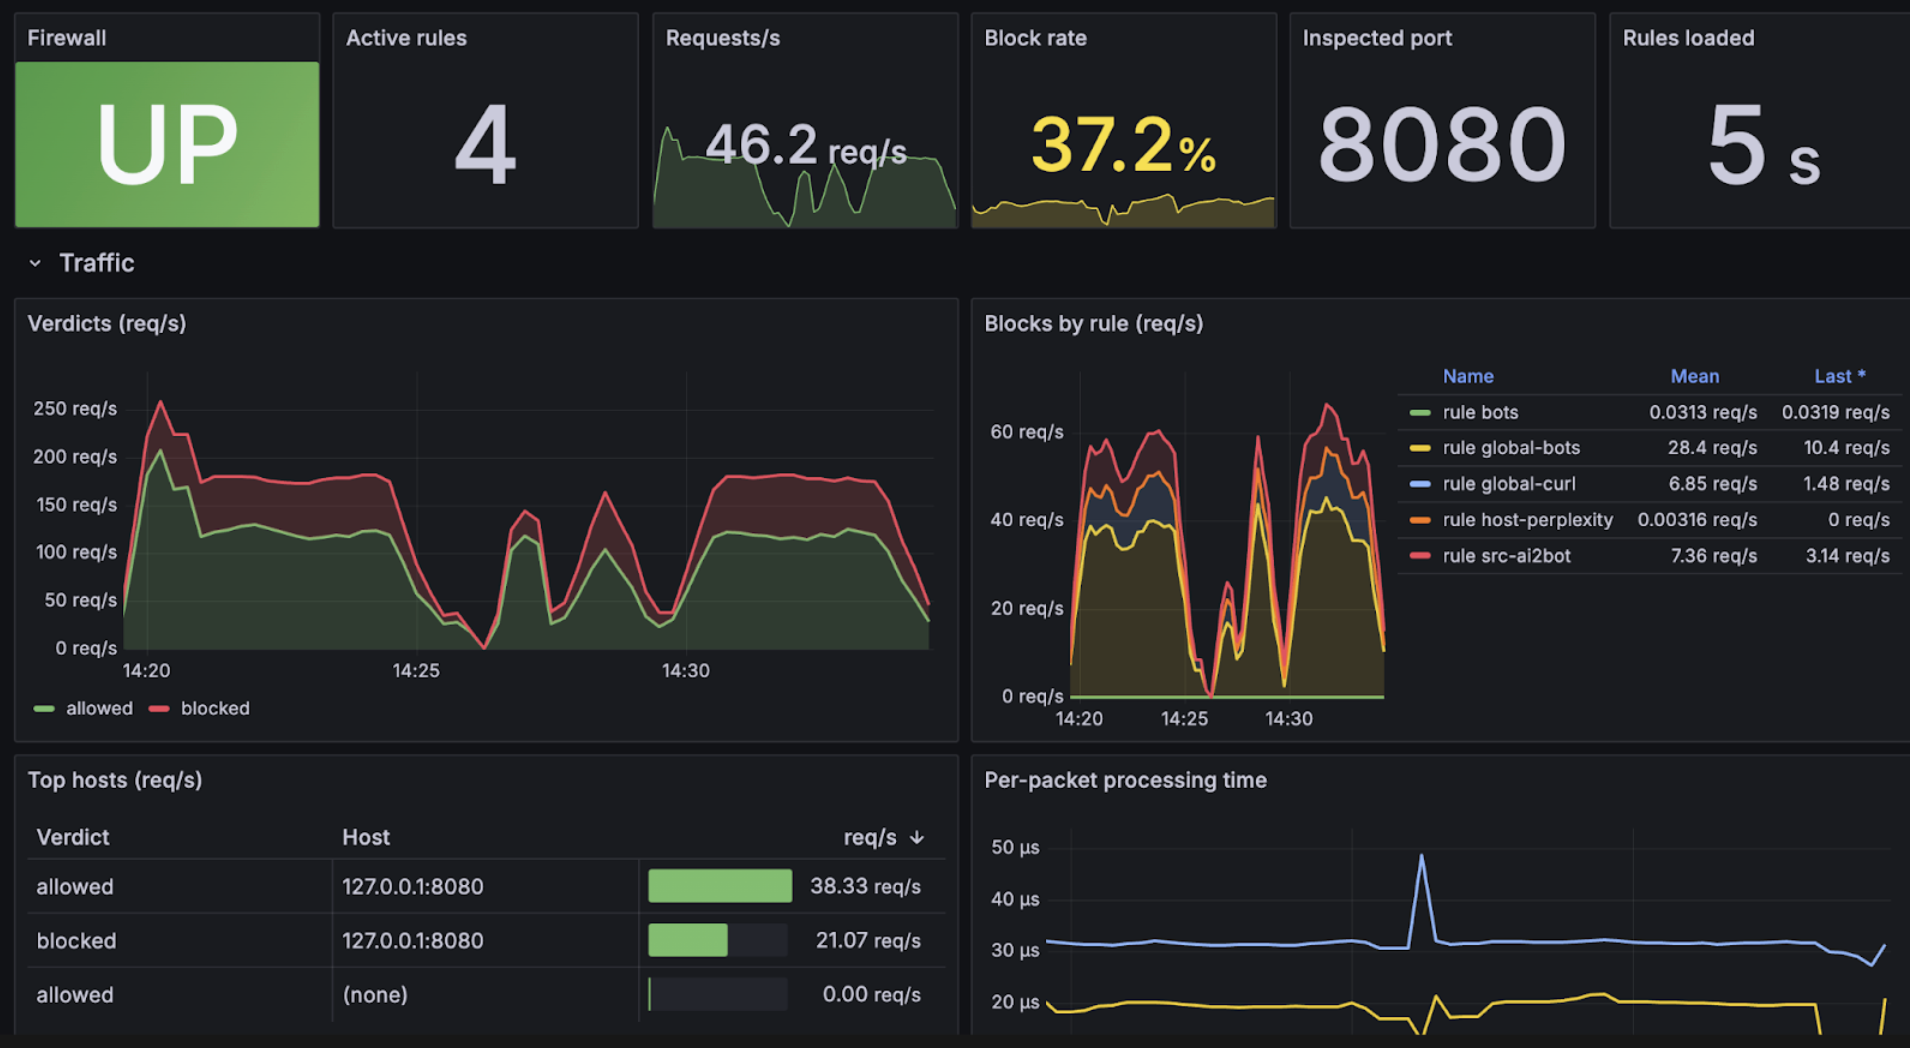
The same loopback capture the latency figures come from: four rules, ~46 req/s, port 8080. The per-packet panel here is per-request processing time, which is why it reads in microseconds rather than the nanoseconds of the matching step.
We export real-time metrics on a Prometheus endpoint and they ship with Grafana dashboards, so you can watch:
- verdicts per second, allowed against blocked, and blocks broken down by rule and by host
- the XDP funnel: packets hooked, passed, and dropped, plus TCP segments inspected, HTTP/2 frames, and headers decoded
- the Aho-Corasick automaton: states used against capacity, accept states, and how many patterns are loaded
- BPF map usage, whether the XDP program is attached, and an at-a-glance UP / ENFORCING status
- time since the last rule reload and the count of reload failures
- source resolution: how many decisions used a trusted
X-Forwarded-For, how many used PROXY protocol, and how many were ignored as untrusted
The dashboard header carries the two signals you check first: is it up, and is it enforcing.
Fragmentation, Retransmits, and Reordering
Because we hook at XDP, we see individual TCP segments before the kernel reassembles them into a stream. Most HTTP/2 HEADERS frames fit inside a single TCP segment in practice, but not all of them, and an attacker who knows about the firewall could deliberately fragment headers across segments to try to evade XDP-only inspection.
An attacker cannot evade detection this way, they can only force traffic onto a slower path. Multi-segment HEADERS frames are reassembled and inspected in the JavaScript surface rather than dropped uninspected. The fragmented case is slower than the XDP fast path, but it is still inspected, and fragmented-frame counts are exposed as a metric so you have hard numbers on how often that path runs on your traffic mix.
Retransmits and out-of-order segments are the same class of problem and deserve naming, because a hook that sees raw segments has to handle them or the HPACK dynamic table drifts out of sync with the client's. A duplicate segment replayed into the decoder, or two segments applied in the wrong order, corrupts table state for every later request on that connection. This is exactly why the table is instrumented rather than assumed: desyncs and mid-stream joins are counted and exported, and a connection whose table state we no longer trust falls back to the userspace path instead of matching against a table we know is wrong. Quantifying how often that happens across a real traffic mix is part of what the production rollout is measuring.
Limitations and Next Steps
This firewall is being tested in production today, sitting in front of real enterprise traffic and making these decisions on live packets. A staged rollout is a more prudent way to ship something that runs at XDP, widening the traffic we see at each stage and gathering metrics to feel confident to keep moving forward.
The measurement we care most about right now is the sustained sweep toward line rate: throughput on named hardware, with the NIC and XDP mode recorded, the traffic mix described, and the rule count stated, reporting means and tails rather than a median. That is the benchmark this post does not have, and publishing it is the next thing we owe anyone evaluating this. The constant-work-per-byte design says the tail holds its shape; production is where we find out. We'll publish what we measure, including anything that surprises us.
Our roadmap is to grow what the matcher can decide on, keep the decision in the kernel, and keep the policy in JavaScript. The larger-capacity automaton is modeled and ready when a customer's blocklist needs it. And because every decision already exports through Prometheus, each optimization ships with its own before-and-after chart. When we say something got faster, you'll see the histogram move.
If you're running traffic you'd like to put behind this, reach out.