Who broke CI this time?

Founding engineer at yeet, working on kernel-side observability and the tooling around it. I write about eBPF, Linux internals, and why your telemetry bill looks the way it does.
It has been no secret that GitHub has had ahem, some reliability issues as of late. It has seemed to improve over the last month or so but since the dawn of vibe coding it has felt like every day leads to a new GitHub outage that blocks my day job for 5-10 minutes and forces me to scroll social media until it is resolved.
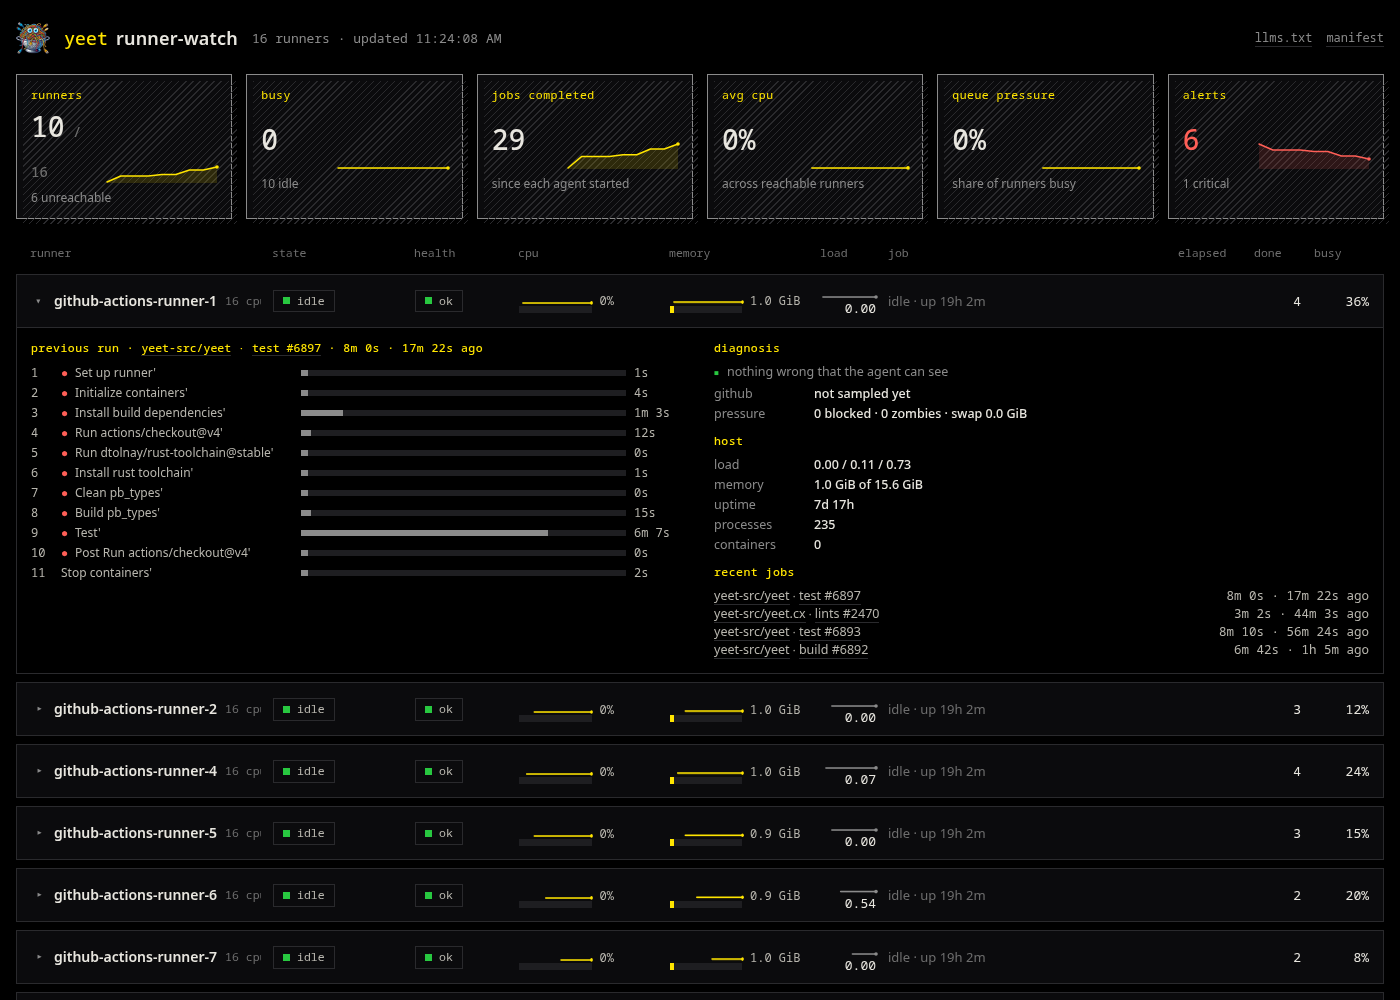
I got tired of guessing whether the problem was on my end or theirs, so I built a page that tells me. This is what it looks like, and the rest of this post is how it got there.
Holding off my rant about how software used to be reliable for another post, today I want to talk about what I've been doing to work around it. Like many others, our deployment process is based on self-hosted GitHub Actions runners, and the real topic here is all the papercuts involved with doing something that a company would really rather you just pay them to do.
I don't know if there's an official term for this, but maybe the closest is the "self hosting tax". I think most of us have come to expect this tax and some even embrace it as the elbow grease required to have things the way you want it. However, sometimes you also just want your shit to work.
Where it gets sticky
When something breaks, it could be our runners or it could be GitHub, and the first question is always the same: is it me or is it GitHub? When both sides could be the problem, figuring out which one suddenly feels like trying to trace the path of a double pendulum.
There are 1000 things that can go wrong, across dozens of machines, and it's a long and grueling process to trace the exact cause down. What I needed was one page I can look at that tells me quickly if something is going wrong with the runners, and whether it's me or GitHub to blame.
Conveniently, I happen to work at yeet and we're particularly good at that sort of thing. So I got to building.
Let's get down to business
It started with a basic premise: I know that yeet has a system graph that should have all of the information necessary to answer my questions. But I have no desire to be swapping between dashboards searching for the answer I want, that would put me back to square one. So here's the concept, we are going to have two services.
The first is the data service. This runs on every actions runner and is responsible for finding and exporting the data so that it's available for our hub to consume. You can think of this a lot like a Prometheus exporter (in fact it's even backwards compatible if you did want to run this in Grafana).
The second service is the hub. The hub serves the dashboard and has one proxy route per runner, so the browser opens a websocket to the hub for each runner and the hub forwards it on. All of the data ends up aggregated into a single page. This can either run on one of the actions runners itself or on a separate machine. Doesn't really matter much, however our actions runners are designed to be able to scale up and down, so I'm going to deploy it on a separate machine.
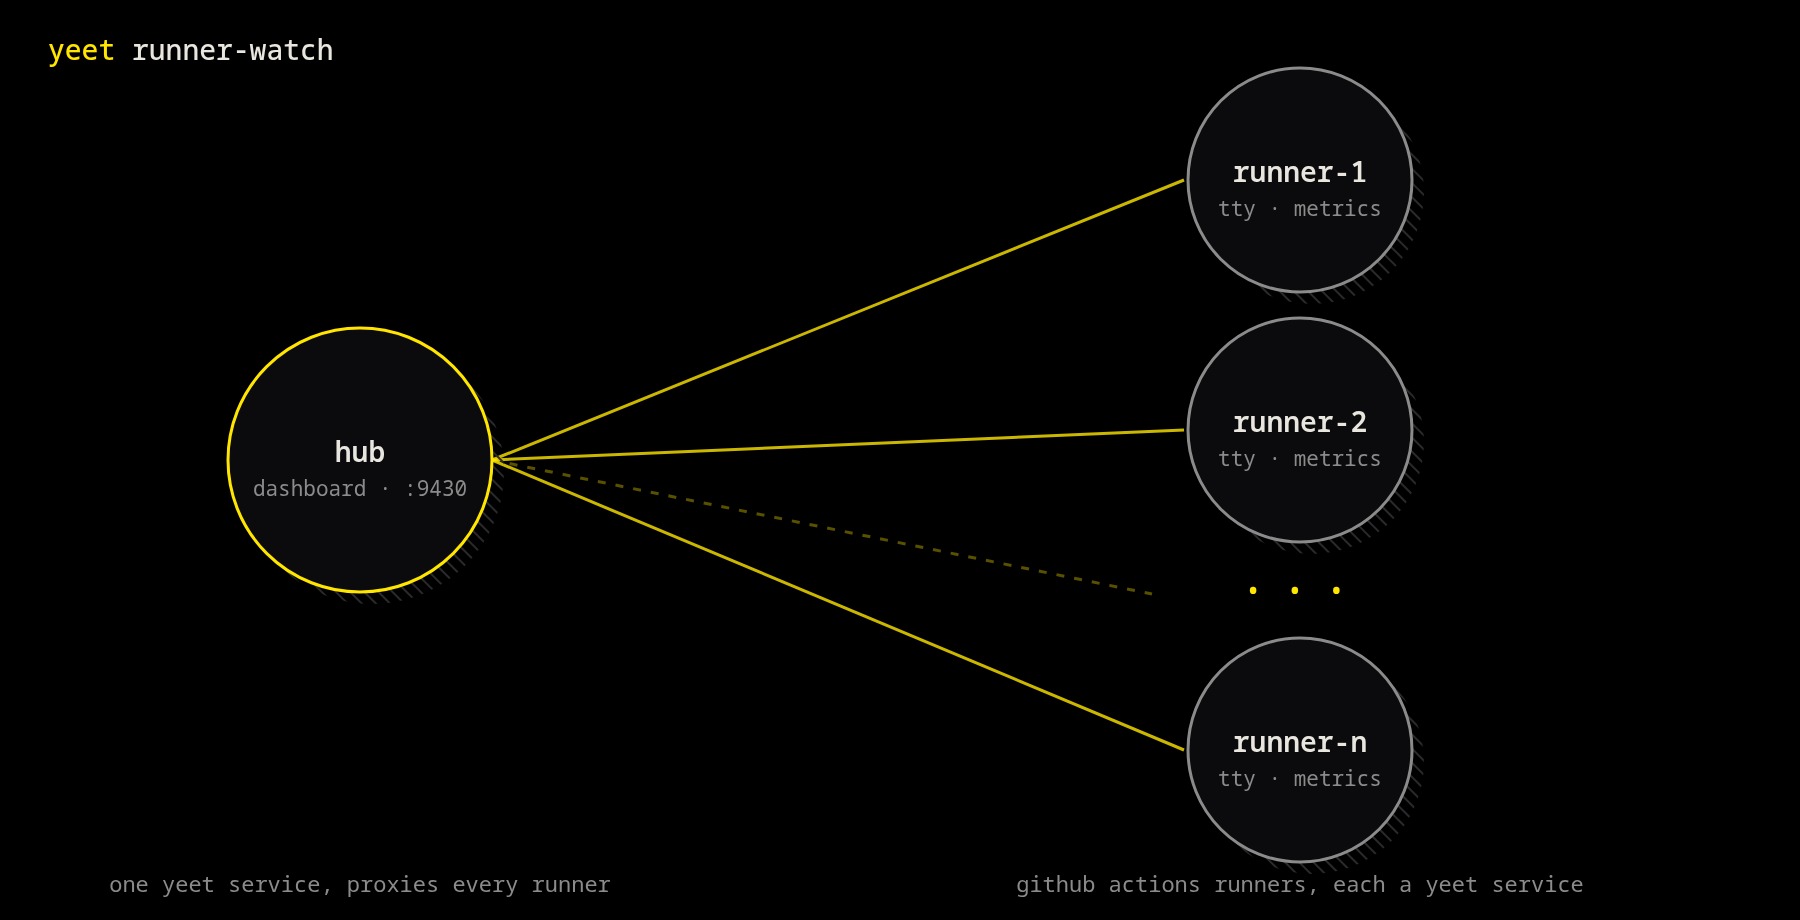
All of our actions runners are on a Tailscale network along with a bunch of other machines, so the install on each runner is one line:
yeet service apply -f https://github.com/yeet-src/runner-watch
The hub is a second service file with one upstream route per runner, generated from the tailnet. More on both of those at the bottom for the curious.
What I got
Across the top there's a row of tiles for the fleet as a whole: how many runners are reachable, how many are busy, jobs completed, average cpu, a "queue pressure" number that is just the share of runners that are busy, and a count of runners with something wrong. Each tile has a sparkline so you can see the last few minutes (in case something weird just finished happening).
Below that is a row per runner, with the busy ones sorted to the top. Each row shows state, health, cpu and memory, load, the job it's running and the current step, how long it's been going, how many jobs it has finished and what share of its uptime it has spent busy.
For the current job you get links to the repo, the run and the commit, the steps so far on a timeline with their real names and timings, and a "waiting on" line that says what the current step is doing right now, whether that's running, blocked on disk, waiting on a socket to some address, or sleeping on a pipe. The idea is to make things out of the ordinary look obvious.
So was it me or GitHub?
The diagnosis section is the part I actually wanted when I started this. It answers the questions from the start.
Who's to blame, GitHub or me? The listener keeps a long-poll connection open to GitHub while it waits for work, and the panel shows whether that connection exists, where it goes, and if it's not there how long it's been gone. If a runner has no connection it's flagged, and if they all have no connection it's pretty safe to say a GitHub intern just pushed a vibe coded fix.
Is it networking? This has been one that has bit me a few times where our internal DNS can get messed up and suddenly all of my runners are connected to the internet yet can't make any requests. If a step is stuck, the "waiting on" line will say it's waiting on a tcp connect to some address, which is a different problem from a step that's waiting on a socket that's open but silent.
Is it resources? Usually this is one that is obvious once you know what you're looking for, but that requires having all the facts laid out in front of you.
Is it all of them or just a few? That's what the sort order and the alerts tile are for. The unhealthy runners float up and the reason is written on the row, so I can see at a glance whether it's one box with a full disk of leftover containers or the whole fleet idling because GitHub stopped handing out jobs.
There's also a timeline view, which I just find satisfying for a quick glance when I'm trying to figure out whats going wrong (for example when I went to take this screenshot I learned a bunch of my machines went offline....)
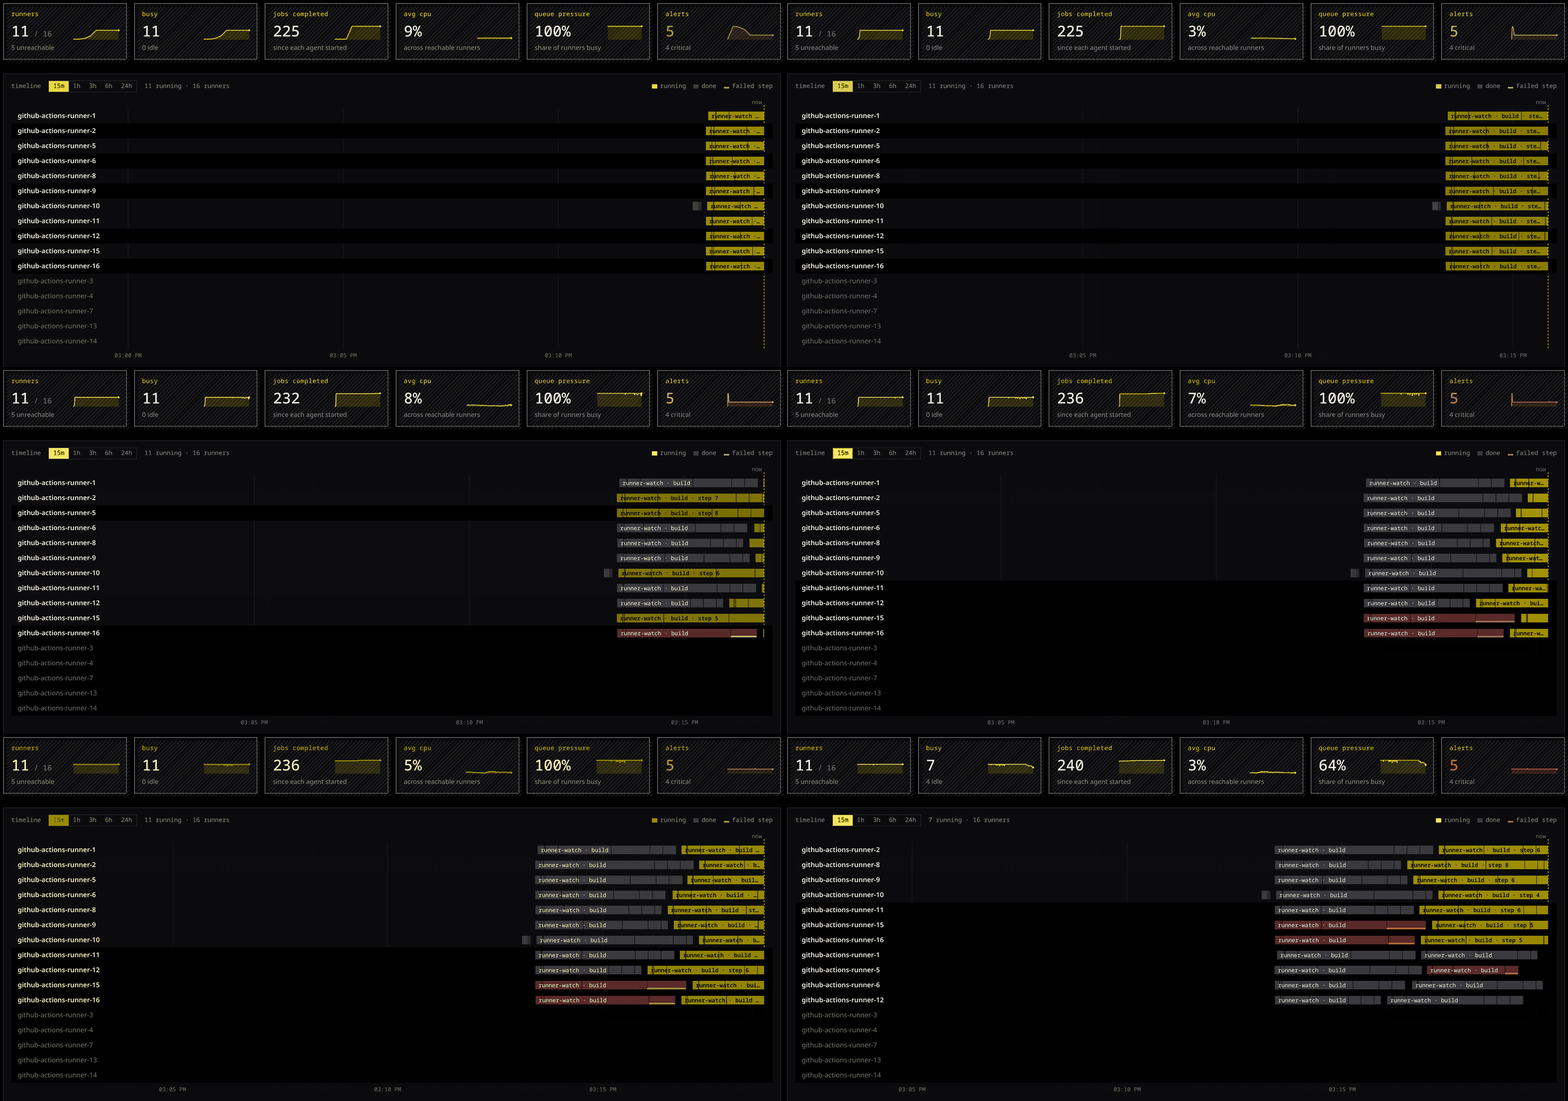
History found a few bonus issues that I might have otherwise missed. A step that's taking twice as long as it normally does for that repo gets marked slow, and containers or processes left behind by a previous job show up as leftovers so they can be cleaned up before they eat the machine.
For everything that isn't a browser
Each agent also serves /metrics for Prometheus, with the health reasons as labelled gauges, so you can alert on runner_watch_listener_connected == 0 or runner_watch_health_level >= 2 from whatever you already run. And /llms.txt on the agents and on the hub is the same information as plain text, if you'd rather point an LLM at it than read the dashboard yourself (since we're all guilty of vibe coding at times).
For the curious: the yeet parts
Everything on a runner comes from one query to yeet's system graph once a second: the process table, cpu counters, memory, load and the docker container list. That's the entire data source. A GitHub runner is a Runner.Listener process with a Runner.Worker child while it has a job, and each step is a child of the worker. So busy or idle, the current step and the repo all fall straight out of the process tree. A second, slower query every five seconds joins the interesting processes' open fds to the tcp table by socket inode. That's how the dashboard knows what the listener and the current step are connected to, and whether a connect is still hanging. Nothing runs inside the job and the runner software is untouched. The process tree already knew all of this, it was waiting for someone to ask.
The agent is a yeet service, which in practice means a service.toml sitting at the top of the repo. It lists the units: isolates, which are just scripts the daemon runs, and a web server with routes that hand connections to them.
alias = "runner-watch"
restart = "always"
working-directory = "."

[units.app]
isolate = "./agent.js"

[units.metrics]
isolate = "./metrics.js"
lazy = true

[units.web]
web-server = "http://0.0.0.0:9420/"

[units.web.routes."/tty"]
target = "app"

[units.web.routes."/metrics"]
target = "metrics"
portal = "console"
tenancy = "per-connection"
app runs forever and writes a JSON frame to its tty every tick. The web server mounts that tty at /tty, so anyone who connects gets a frame a second. metrics is lazy and per-connection: a GET spawns a fresh isolate, it takes one sample, prints the Prometheus exposition and exits, and the exit is what ends the response. /llms.txt is the same trick with markdown.
That file is the entire deploy artifact. I have a graveyard of ansible roles that worked great on the previous Ubuntu LTS, and this is the first time in a while I've deployed something to the fleet without adding to it.
This is also why the install is one line. yeet service apply clones the repo, reads service.toml off the top, and makes the service on that host match it. Run the same line again after a push and that's the upgrade. It only restarts the isolates that changed and leaves the web server up, so the dashboard doesn't even blink. This is the part I'm most pleased with, because deploying to sixteen runners used to be the chore I put off until someone asked why the fix wasn't live yet.
The hub is one more service file: a static route for the dashboard and an upstream route per runner, /r/<name>/ forwarding to that runner over Tailscale, websockets included. It's generated because the roster comes from tailscale status, but it's the same shape. The hub never talks to GitHub. It knows sixteen hostnames and forwards traffic, which is as much as I trust it with.
[units.web.routes."/"]
static = "./public"

[units.web.routes."/r/github-actions-runner-1"]
upstream = "http://github-actions-runner-1:9420/"
This is where the runners make themselves visible, and the direction is backwards from what I expected. Every yeet web server publishes a manifest of its routes at /.well-known/yeet/manifest.json. When the hub gets an upstream route, it dials that runner's manifest stream and holds the websocket open, and the runner pushes its full route list down it every time something changes. The hub folds those into its own manifest, so the hub's lists each runner's /tty and /metrics for as long as that runner is answering. If a runner goes dark, its routes drop out and the hub redials every couple of seconds until it comes back, with no state to clean up because every push is a full snapshot.
The dashboard is dumb on purpose. It fetches the hub's manifest, finds every /r/<name>/tty in it, opens a websocket to each through the hub, and does the aggregating in the page. Nobody tells it how many runners there are. Adding a runner is one more route and an apply. I've done it in the middle of an outage. It worked the first time, which I can't say about anything else in this pipeline.
The code is at github.com/yeet-src/runner-watch, hub and job hook included in the README.
Oh, and the first thing the dashboard told me when I turned it on was that one of my runner VMs had no actions-runner process on it at all. So yeah. That one was me.