Intro
yeet is a runtime for developing tools that observe and control your programs. It's available today as a terminal-based interface.
Install
The easiest way to install yeet is through the install script — Linux only:
curl -fsSL https://yeet.cx | sh
macOS and Windows users can run yeet via Docker — see Running with Docker (macOS/Windows).
If you prefer not to use the one-line installer, you can set up yeet manually.
Login
Once installed, authenticate with your yeet account:
yeet login
This will give you a link to authenticate in your browser. Once authenticated, you're ready to go.
Build
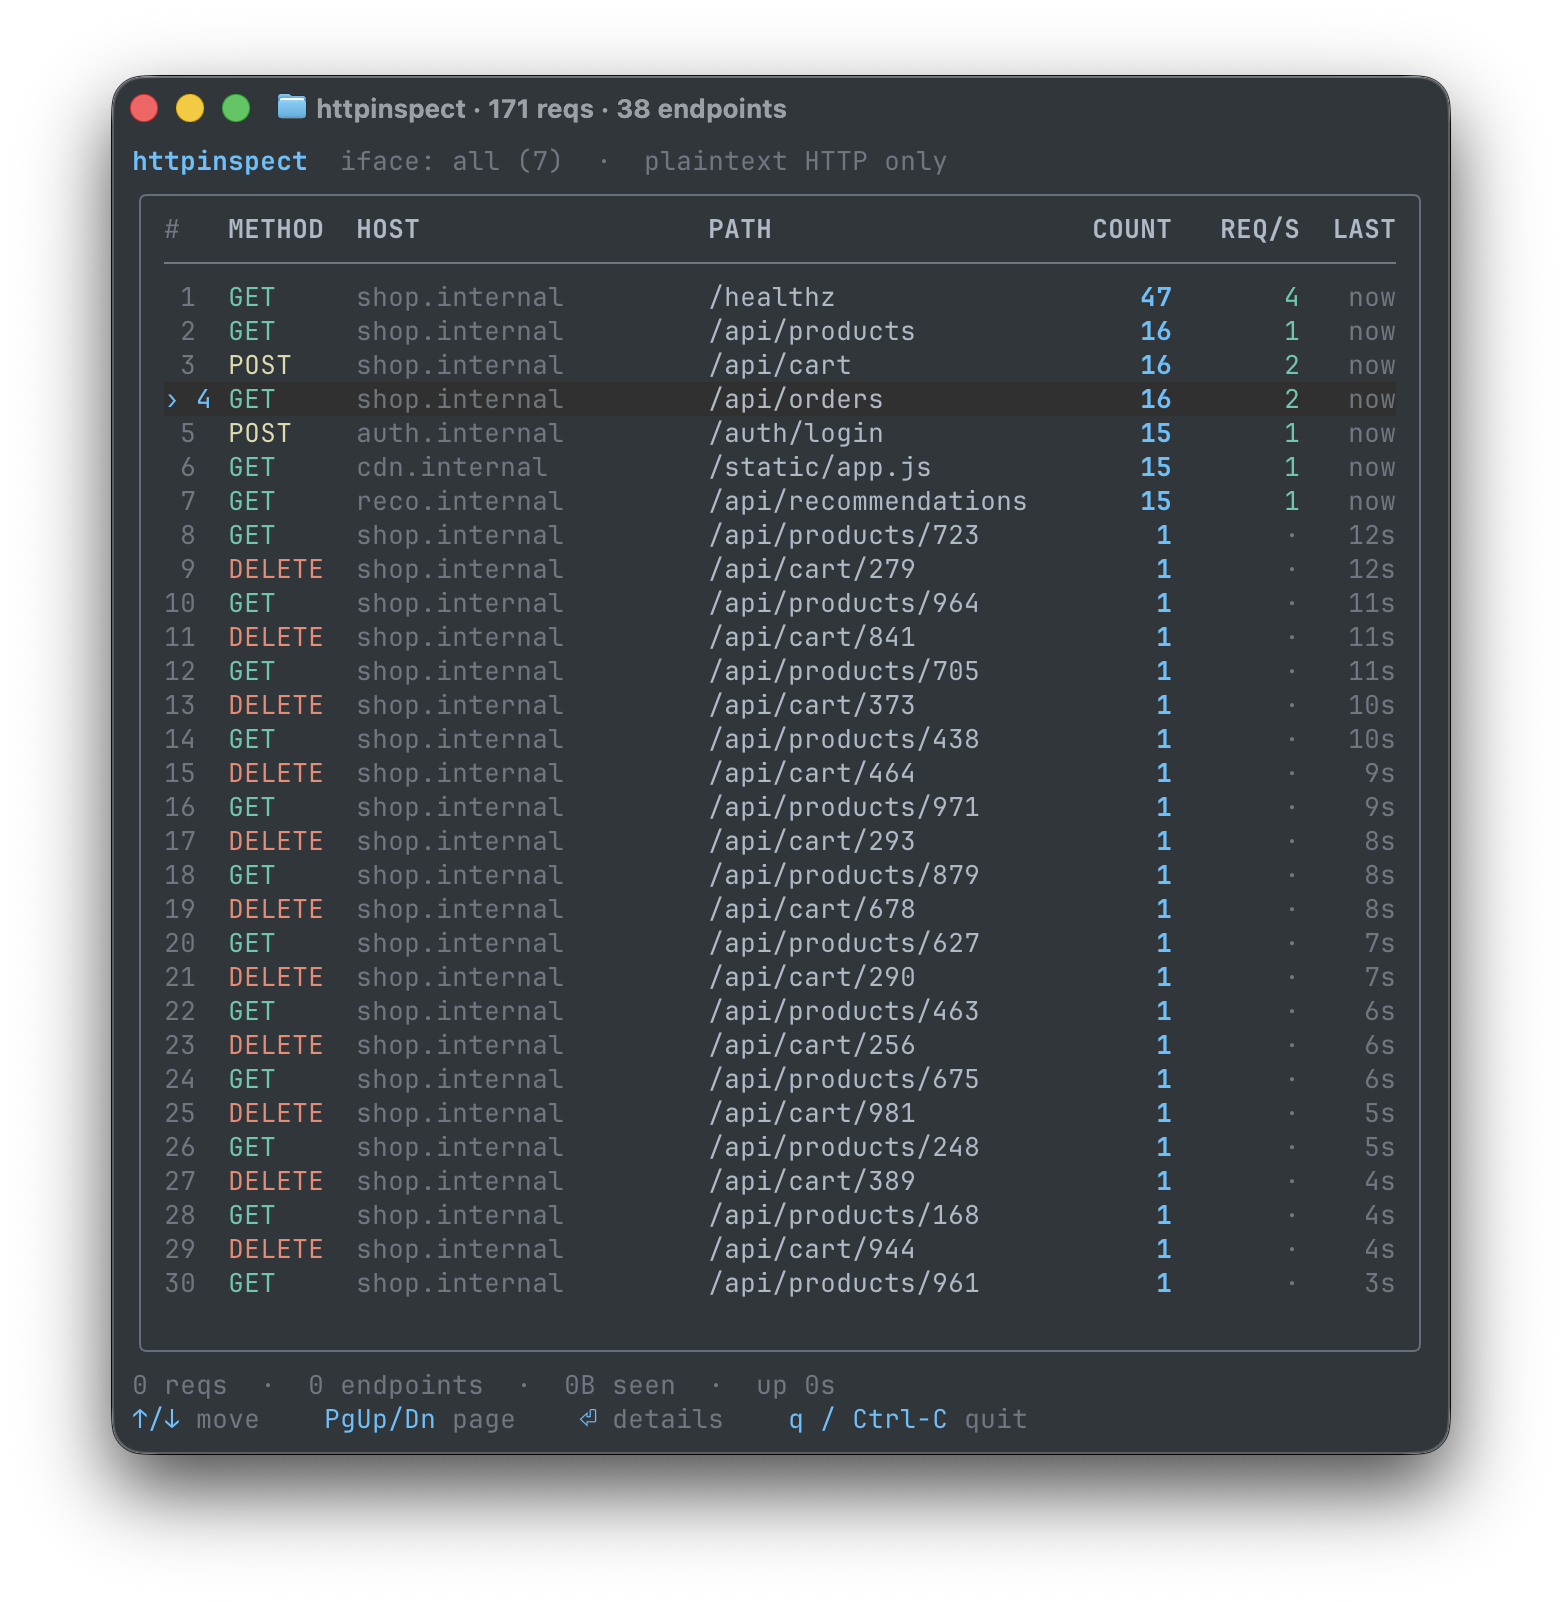
yeet provides a library of tools ready to use. Open your first tool with this command:
yeet run github:yeet-src/httpinspect
Tools you build with yeet provide a live view of your system. Press Ctrl+C to cancel a running tool at any time.
Customize
yeet tools are built with JavaScript. You can work with your AI model to customize any tool. Browse the Tools library to find a starting point.
Hand it to your agent
Everything a yeet tool can observe is described by one typed schema. Have your agent start by dumping it:
yeet graph dump
That prints the system graph's full GraphQL SDL: every process, CPU, memory, network, Docker, GPU, and sensor field, with types and units. An agent that has read it knows what it can subscribe to and can write a working tool without guessing. yeet graph query '<gql>' lets it check any field against the live machine before committing to it.
For the rest, point it at the raw Markdown docs. /docs/raw/index.md lists every page with a one-line summary, and each page is fetchable as plain Markdown, so a model can read the programming model and API reference directly.